iNaturalist Sankey Diagram
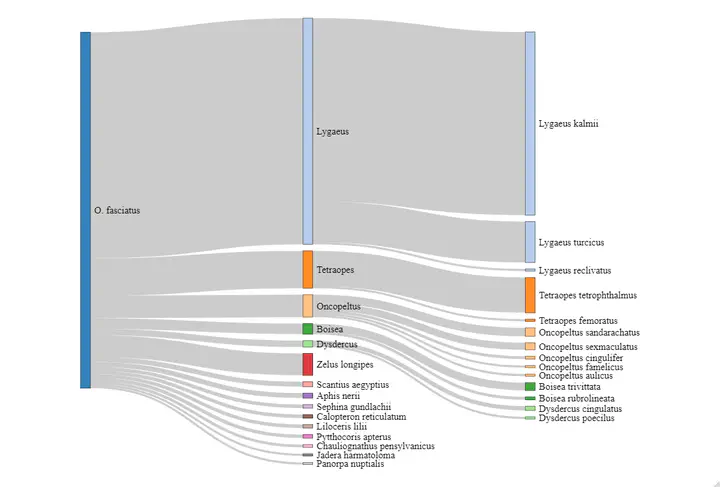
Code to make this figure is below and can be downloaded here: Change the taxon_id and the taxon_name to your species of interest. Find your taxon id from the iNaturalist search function, when you search your species name in the search bar, like “large milkweed bug”, the resulting url has the place name in the url (ex. for the url https://www.inaturalist.org/observations?taxon_id=55556 the taxon id is 55556)
#install.packages("tidyverse", "devtools", "networkD3")
#library(devtools)
#devtools::install_github("hrbrmstr/curlconverter")
library(curlconverter)
library(tidyverse)
library(networkD3)
taxon_id <- 47219
taxon_name <- "Apis mellifera"
####API Call####
api <- paste("curl -X GET --header 'Accept: application/json'
'http://api.inaturalist.org/v1/identifications/similar_species? is_change=false¤t=true&order=desc&order_by=created_at&taxon_id=", taxon_id, "'", sep="")
my_ip <- straighten(api) %>%
make_req()
dat <- content(my_ip[[1]](), as="parsed")
links <- data.frame(target = rep(NA, dat$total_results), value = rep(NA, dat$total_results))
for(i in 1:dat$total_results){
links$target[i] <- dat$results[[i]]$taxon$name
links$value[i] <- dat$results[[i]]$count
}
####Formatting####
links %>%
separate(target, c("genus", "species")) %>%
group_by(genus) %>%
summarise(n = n(), value = sum(value)) %>%
filter(n > 1) %>%
mutate(target = genus)%>%
select(-n, -genus) -> genera
genera$source <- rep(taxon_name, nrow(genera))
links$source <- rep(taxon_name, nrow(links))
links %>%
separate(target, c("genus", "species"), remove = F) -> links
links$source[links$genus %in% genera$target] <- links$genus[links$genus %in% genera$target]
links <- select(links, -genus, -species)
links <- bind_rows(links, genera)
####SANKEY####
nodes <- data.frame(
name=c(as.character(links$source),
as.character(links$target)) %>% unique()
)
# With networkD3, connection must be provided using id, not using real name like in the links dataframe.. So we need to reformat it.
links$IDsource <- match(links$source, nodes$name)-1
links$IDtarget <- match(links$target, nodes$name)-1
# Add a 'group' column to each node. Here I decide to put all of them in the same group to make them grey
nodes$group <- as.factor(c("my_unique_group"))
# Make the Network
p <- sankeyNetwork(Links = links,
Nodes = nodes,
Source = "IDsource",
Target = "IDtarget",
Value = "value",
NodeID = "name",
sinksRight=F,
fontSize = 20,
iterations = 23,
nodeWidth = 5)
ggsave(paste(gsub(" ", "_",taxon_name), "sankey_plot.png"), p, height = 10, width = 10)